Cursors
Use cursors to read specific datapoints on a graph.
When a simulation is run, cursors do not appear on the graph by default. You can switch on the following cursor types from the graph's properties:
- X axis - displays two cursors that can be dragged along the graph's x-axis.
- Y axis - displays two cursors that can be dragged along the graph's y-axis.
- Track - displays two x-axis cursors. When dragged, each x-axis cursor moves a corresponding y-axis cursor to read a specific data point. This is disabled for AC sweep simulation and Parameter sweep AC simulation.
See below for examples.
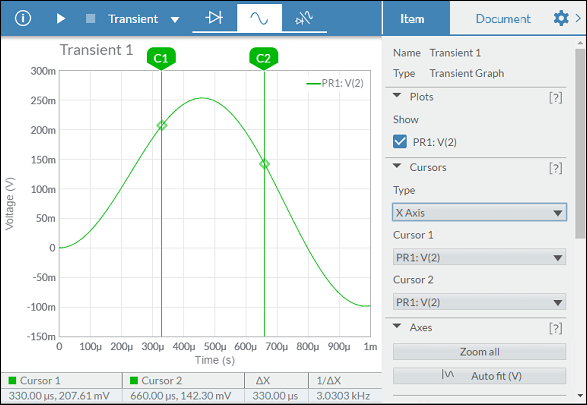
X axis
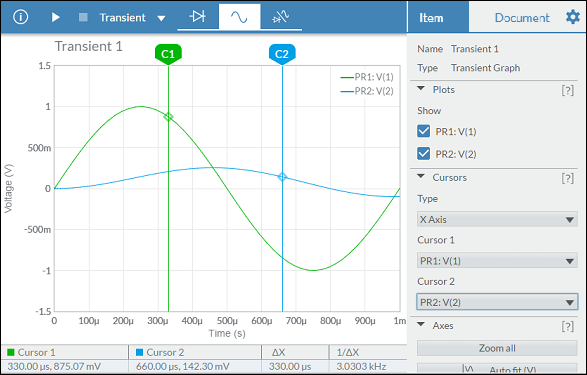
Select X Axis from the Type drop-down menu in Cursors.
C1 is Cursor 1 and C2 is Cursor 2. Drag cursors from their handles (C1, C2), or anywhere along the cursor. The readings in the table below the graph reflect the simulation data at the cursor positions.
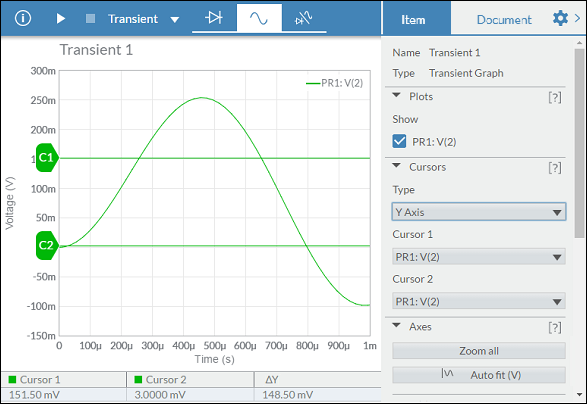
Y axis
Select Y Axis from the Type drop-down menu in Cursors.
The readings in the table below the graph reflect the y axis value of each cursor. Drag cursors from their handles (C1, C2), or anywhere along the cursor to take a new reading.
Y axis cursors do not show intersections with the selected plot, due to the potential for numerous intersection points.
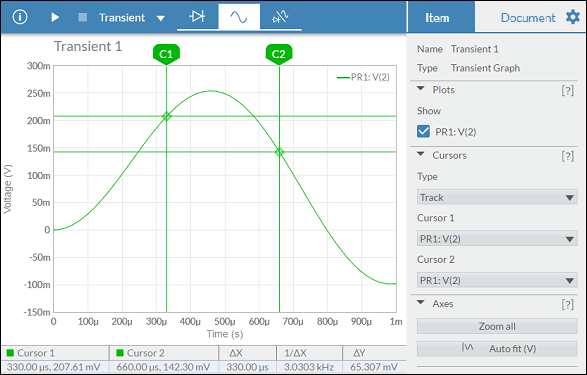
Track
Select Track from the Type drop-down menu in Cursors.
The readings in the table below the graph reflect the simulation data at the cursor positions. Drag cursors from their handles (C1, C2), or anywhere along the cursor to take a new reading.
Using cursors with multiple traces
When you have more than one trace on a graph, you can select which trace each cursor reads. In the following example, C1 and C2 are reading the cursors from the PR1: V(1) trace. Notice that the cursors and their handles are green, matching that trace's color. The color beside Cursor 1 and Cursor 2 in the data table is also green.
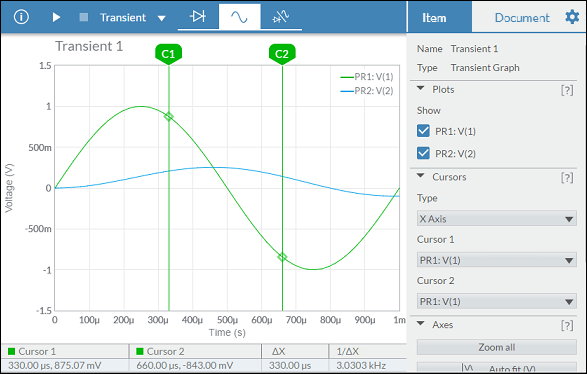
Change the selections in the Cursor 1 and Cursor 2 drop-down menus to take readings from other traces. The color of the cursors, their handles, and their legends in the data table change to reflect the new selection. The data in the table also changes.
In the example below, Cursor 2 was changed to read data from trace PR2: V(2):
Related Information
Interactive simulation
Transient simulation
AC sweep
DC sweep
Parameter sweep
