Data plotter
Use the data plotter to pull external data into the grapher. It can then be compared against simulated results.
You can place a data plotter by itself, on a design with other components, or on a design with other components and probes.
The data plotter gets data from an external .csv file that is referenced from the data plotter's properties. If the referenced file contains data for more than one plot, you must select the one to display.
The data plotter supports Transient and AC sweep simulation.
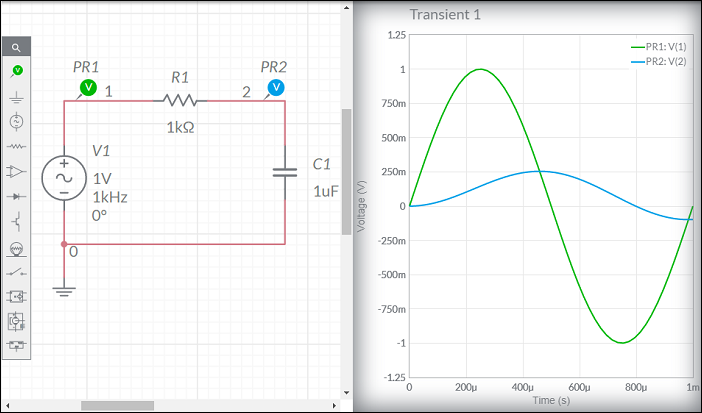
The remainder of this topic uses the example below. Its simulation results were previously downloaded as a .csv file from Multisim Live (RC filter.csv). This file contains the data for two plots; PR1: V(1) and PR2: V(2).
Referencing a data file
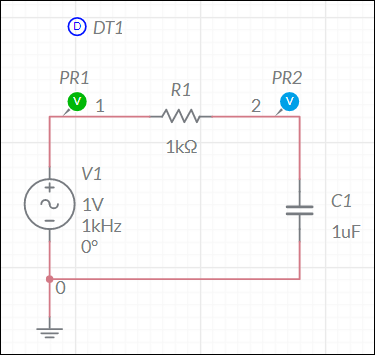
- Build the circuit shown above, or make a copy of it from the Help Circuits user group. This is a closed group. You can open and copy the circuits in this group, but you cannot join it.
- Place a data plotter from the Analysis and annotation sub-palette (DT1 in the example below).
- Double-tap the data plotter to open its properties, tap
 and navigate to the desired file.
 RC filter.csvis used in this example. - Choose the plot to view in Plot. For this example, choose PR2:V(2).
- Run a simulation that matches the Data type shown in the data plotter's properties (Transient in this example). If you run a different type, the data plotter will be disabled.
As expected, the plots for PR2 and DT1 are the same.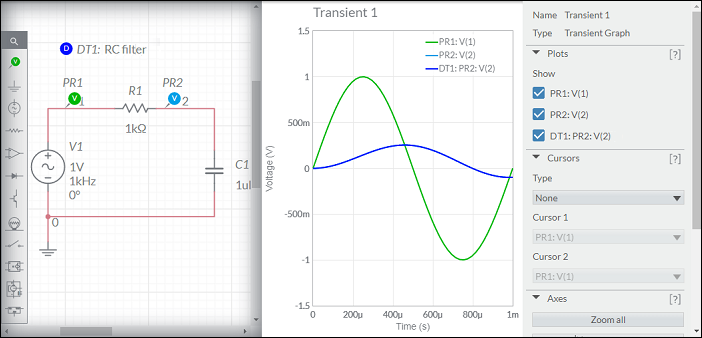
- Change the value of R1 to 1.5kΩ and simulate again.
The output at PR2 has reduced compared to the DT1 plot.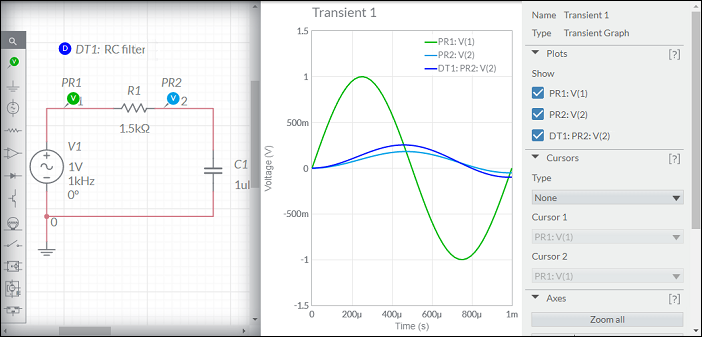
Tip. Use multiple data plotters and referenced data files to compare different simulation types. The data plotter plots that appear on the grapher will be those whose Data type matches the selected simulation type. The total file size for all data plotters in a design cannot exceed 100 MB.
