Transient simulation
Transient simulation computes the circuit's response as a function of time. It stops after a set time.
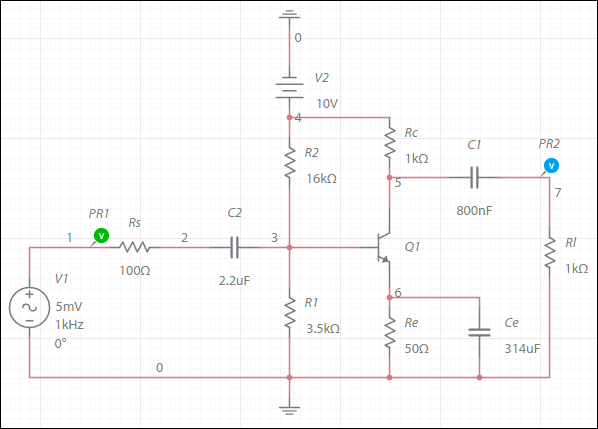
This topic uses the following circuit (CE amplifier).
You can build this circuit, or make a copy of it from the Help Circuits user group. This is a closed group. You can open and copy the circuits in this group, but you cannot join it.
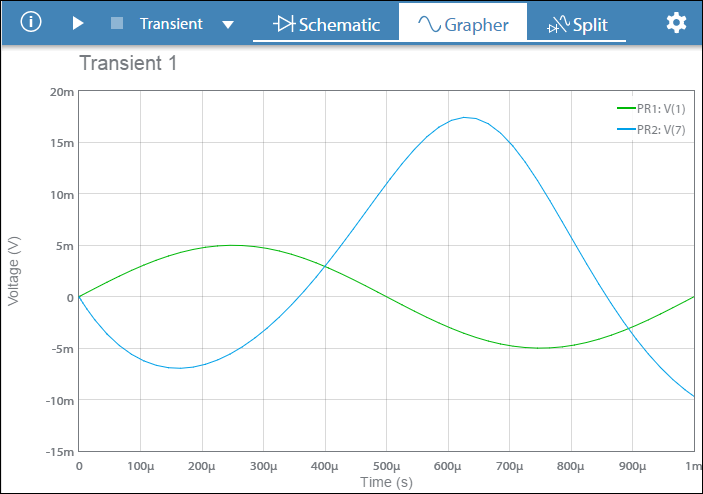
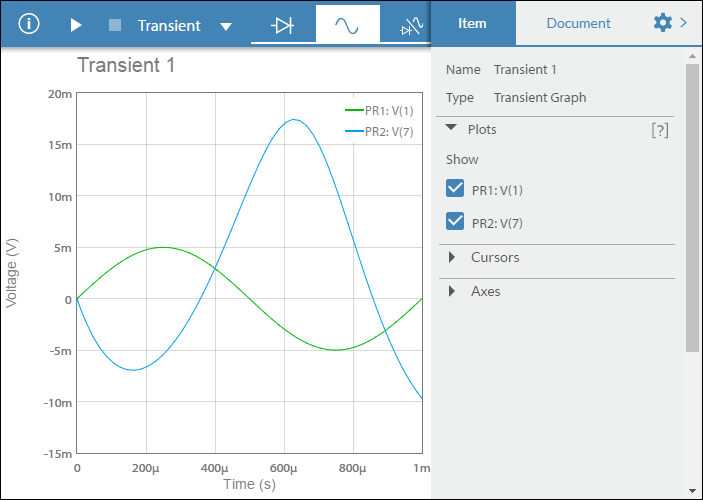
When you run a transient simulation, the grapher immediately displays, and runs until the End time value in Simulation settings.
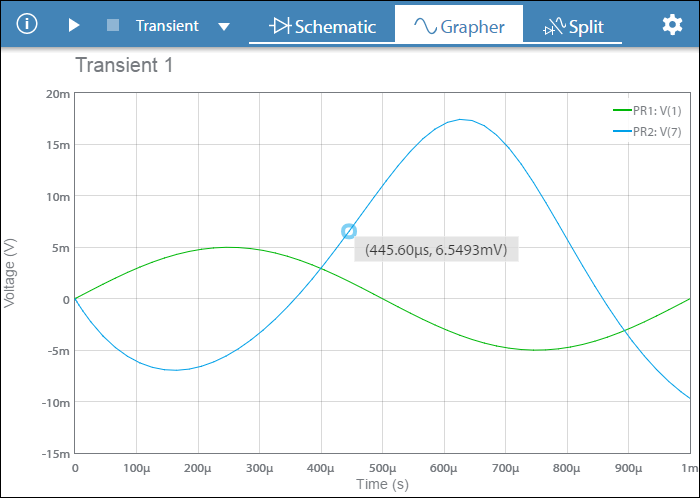
Hover the cursor over a specific point on a trace to see its value. For touchscreen devices, tap a specific point on a trace. The displayed value remains until you tap elsewhere.
Tap ![]() to open the configuration pane. For transient simulation, this contains Plots and Axes sections. You can also double-tap on the grapher.
to open the configuration pane. For transient simulation, this contains Plots and Axes sections. You can also double-tap on the grapher.
Plots
Use this section to show or hide traces on the grapher. In the example below, both PR1 and PR2 are selected.
To hide a trace, deselect its checkbox.
Cursors
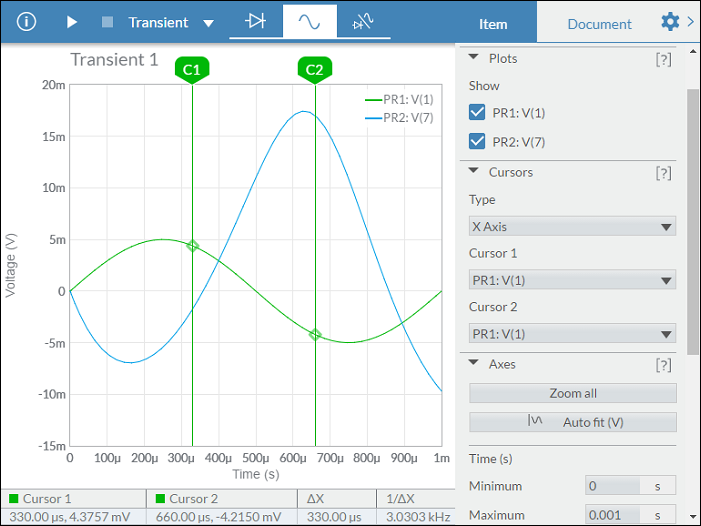
You can switch on cursors to get more information. X axis, Y axis and Track cursors are available for transient simulation. This example uses X axis cursors.
In the following example, X Axis is selected from the Type drop-down menu, in Cursors.
The table displays two values for Cursor 1 - Time and Voltage (330.00 μs, 4,3757 mV). Similar values are displayed for Cursor 2.
The third column of the table displays ΔX = X2 - X1.
The fourth column displays 1/ΔX.
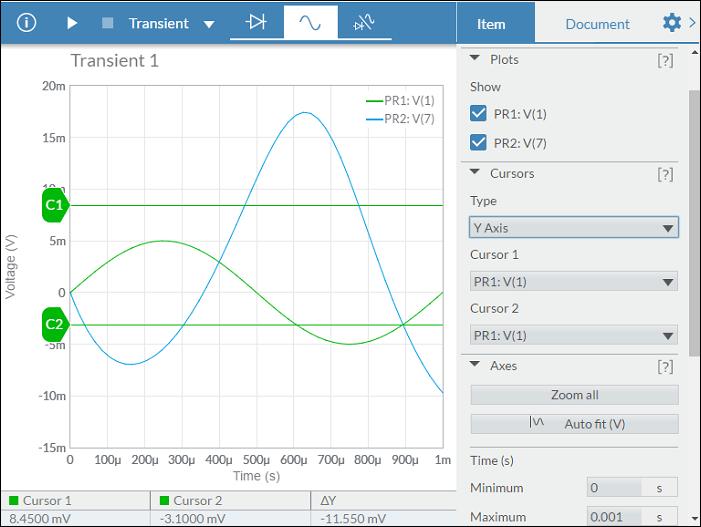
Notice how the data in the table changes when you select Y Axis for the cursor Type:
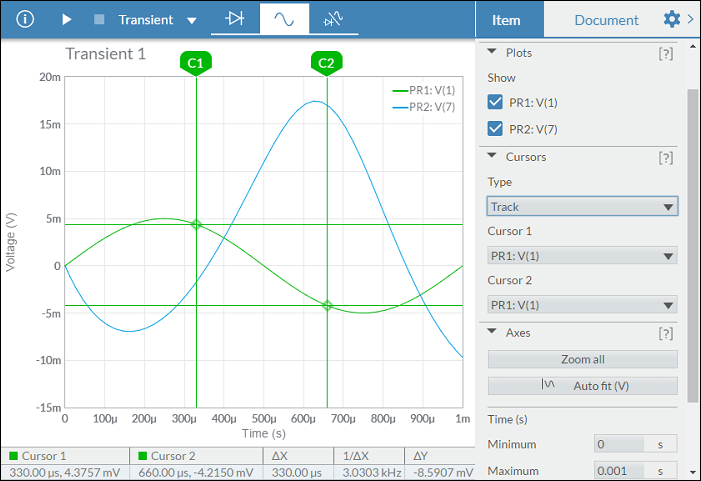
When Track is selected as the cursor Type, the table contains data similar to the following:
Axes
Use this section to change the horizontal and vertical ranges of the display.
Tap [?] to show inline help on the available settings.
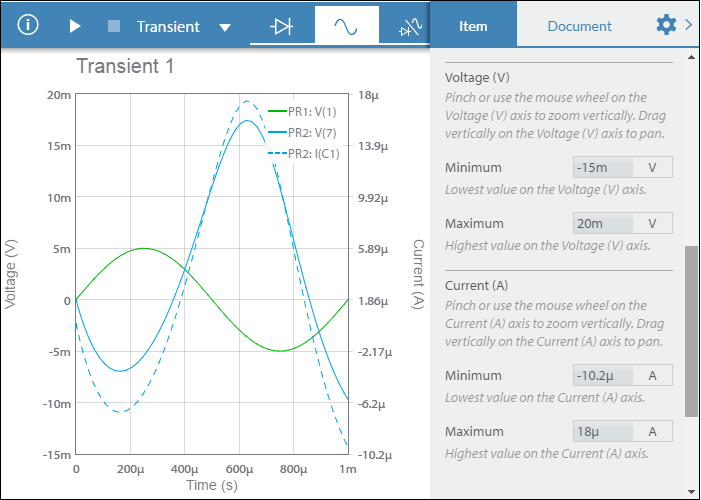
In the example above, only voltage probes are placed, so there is only a Voltage (V) y-axis. If a current probe had also been placed, the grapher would appear similar to the following. Notice that there is now a Current (A) axis in addition to the Voltage (V) axis, and there are both Voltage (V) and Current (A) Axes settings in the configuration pane.
Minimum and Maximum settings (see below) are preserved from one simulation run to the next if you set them by manually entering values in their respective boxes. This could cause the grapher to appear empty if the new signal is not within the manually set range.